Are Mesa rents cooling, holding, or ready to climb again? If you own or plan to buy a single‑family rental in Mesa, understanding the local rent cycle can make the difference between steady cash flow and costly vacancies. You want clarity you can act on, not just headlines about the broader Phoenix market.
In this guide, you’ll learn how Mesa fits into the Phoenix‑Mesa‑Chandler metro trendline, what drives vacancy and leasing seasonality, what a realistic turnover budget looks like, and how digital leasing tools help you shorten downtime. You’ll also get a simple playbook and KPIs to track so you can make decisions with confidence.
Let’s dive in.
Mesa rent trends at a glance
Mesa follows the broader Phoenix metro pattern of rapid rent growth in 2020–2022 followed by cooling and localized corrections in 2023–2024. That normalization phase is still working through the market, and it looks different by neighborhood and property type. Single‑family rentals compete with both the for‑sale market and nearby multifamily options, so supply shifts on either side can affect your rent outcome.
What’s moving the needle today:
- Interest rates: Higher mortgage rates can keep more households renting longer and can slow investor purchases. Both pressures support rental demand but may temper rent growth.
- Jobs and migration: Employment growth in tech, healthcare, and logistics across the Phoenix MSA supports steady in‑migration, which is a key demand driver for Mesa rentals.
- Housing supply: New single‑family permits and for‑sale listing inventory change the buy‑versus‑rent math for local households. More supply can ease rent pressure; tighter supply can support firmer pricing.
What to watch each month
You do not need to track everything, but these metrics will give you a reliable read:
- Typical rent for 2–3 bedroom SFRs in Mesa (by ZIP if possible).
- Month‑over‑month and year‑over‑year rent change, with a note on asking versus effective rent.
- Days on market for rental listings and active rental inventory counts.
- Lease renewal rate if you own units, or use regional SFR benchmarks when local data is missing.
- Employment and unemployment trends for the Phoenix MSA.
- New single‑family building permits in Mesa or Maricopa County.
Recommended data sources include Zillow Research rent indexes, Apartment List or RENTCafé city snapshots, HUD Fair Market Rents for baselines, BLS employment data, ARMLS for rental listing dynamics, and City of Mesa permitting. When a source mixes multifamily and single‑family, label it clearly and use it directionally.
How to read the numbers
- Asking vs. effective rent: If concessions become more common, effective rents can flatten even when asking rents appear steady. Track both if possible.
- MoM vs. YoY change: Month‑over‑month moves show seasonality and momentum; year‑over‑year shows the bigger picture. Use both lenses before adjusting rent.
- Days on market: Rising days on market usually signal softer demand or overpricing. If your DOM is above the city or ZIP average, review price, photos, and property condition.
- Inventory and new listings: More choices for renters can lengthen lease‑ups. Tight inventory supports faster absorption.
Vacancy and leasing seasonality in Mesa
Mesa generally sees higher leasing activity from May through August. Applicant volume often dips from late fall into winter, which can add days vacant if you list during that period. Properties near colleges may feel the academic calendar, and trade hiring cycles can also shape move‑in timing.
Your takeaway: align lease expirations to spring or early summer when possible, and plan your turnover schedule to hit peak demand.
Benchmarks and what they mean
Where SFR‑specific vacancy rates are unavailable, metro‑level rental vacancy can serve as a guide. Treat it as directional, not a precise comp for your property. Focus on these practical yardsticks:
- Days vacant between leases: Track your average by season. If your off‑season gap is consistently longer, adjust expiration dates or consider short renewals to realign timing.
- Renewal rate: A rising renewal rate reduces turnover costs and protects cash flow. If renewals slip, audit maintenance responsiveness, rent increases, and communication.
- Applications per listing: This shows demand intensity. If applications are light, revisit pricing, photos, yard care, and listing exposure.
Practical actions by season
- Spring to summer: List 7–10 days before ready, schedule professional photos, and price at the market midpoint to start. Tighten pricing based on applicant feedback within the first week.
- Fall to winter: Price competitively, shorten the approval timeline with online applications and screening, and consider small one‑time concessions like reduced admin fees or a minor rent credit.
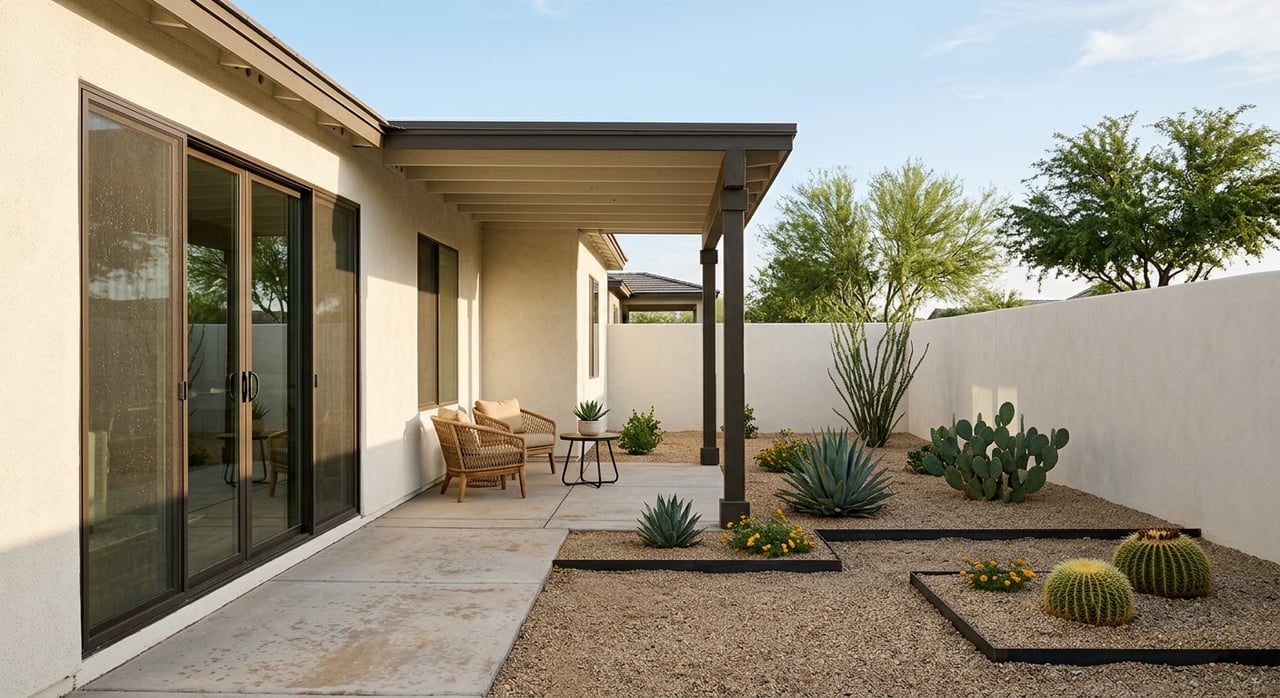
- Any month: Keep curb appeal sharp. Fresh gravel, trimmed trees, and clean exterior paint matter in single‑family more than you might expect.
Turnover costs and time‑to‑ready
Turnovers are where many SFR budgets get squeezed. Single‑family homes often cost more to turn than apartments because of yards, larger square footage, and additional systems.
Typical cost ranges to use as planning guides:
- Basic turn: cleaning, minor repairs, rekey, yard refresh. Often about $500 to $2,500 per turn.
- Moderate turn: interior paint, flooring repairs, multiple system fixes. Often about $2,500 to $6,000 or more.
Time to ready varies with scope and contractor availability:
- Simple turn: about 3–7 days.
- Moderate scope: about 2–4 weeks, especially if you need to schedule trades.
- Major repairs: can add multiple weeks.
Common line items to budget
- Cleaning and trash haul
- Paint touch‑ups or full interior repaint
- Flooring cleaning, repairs, or replacement
- HVAC, plumbing, electrical, and appliance service or replacement
- Landscaping and irrigation repairs
- Rekeying or smart‑lock updates
- Marketing, photos, utilities during vacancy, inspection fees, and leasing commission if applicable
Mesa‑specific considerations:
- Heat and HVAC: Preventive A/C service before summer can avoid emergency calls and longer downtime.
- Water‑wise landscaping: Converting to low‑water yards can cost more upfront but often reduces ongoing expenses and boosts appeal to many renters.
- Trade seasonality: Spring and summer book up quickly for painters, flooring, and HVAC. Pre‑schedule key vendors when you know a lease will end.
Model vacancy loss and breakeven
Use a simple framework to compare options:
- Vacancy loss formula: Vacancy loss = (Days vacant / 365) × Annual market rent.
- Turn cost: Sum your line items for a total per‑turn expense.
- Upgrade breakeven: If you invest in an upgrade, amortize it. Example approach: a $6,000 improvement with a 6‑year life equals $1,000 per year before considering any rent lift. Add expected vacancy and maintenance to see the true annual cost.
Then ask: Will the upgrade raise rent enough or increase renewal odds enough to beat the combined cost of the turn, vacancy, and capital amortization? If yes, proceed. If not, stick to maintenance‑only.
Leasing and tenant portals to protect cash flow
Digital leasing and tenant portals help you move faster and more reliably through each step of the leasing cycle. For single‑property and small‑portfolio owners, these tools can be the difference between a two‑week lease‑up and a four‑week vacancy.
Core features that matter:
- Listing syndication and applicant tracking
- Online applications, screening, and e‑signature lease execution
- Online rent collection with reminders
- Maintenance request ticketing and status updates
- Tenant communications, document storage, and move‑in/out checklists
- Renewals management with automated offers
Why it helps:
- Faster lease‑ups: Immediate applications and streamlined screening shorten the path from first showing to signed lease.
- Better collections: Automated reminders and online payments can improve on‑time rent and reduce follow‑up.
- Higher renewals: Easier maintenance requests and clear communication increase satisfaction and retention.
- Data and automation: Dashboards turn guesswork into measurable KPIs so you can make timely decisions.
Evidence from industry case studies often shows improvements when these tools are well‑implemented, but results vary by market and execution. Focus on your before‑and‑after metrics to verify impact.
KPIs to track quarterly
- Average days vacant and time‑to‑lease
- Applications per listing and application‑to‑lease conversion rate
- Renewal rate and average tenant tenure
- Percent of rent collected on time and delinquency rate
- Turn cost per home and average turn time
- Maintenance response time and resolution rate
Local rules and risk checks
Arizona’s Residential Landlord and Tenant Act sets key rules for notices, deposits, and remedies. Security deposit maximums, accounting, required disclosures, and notice periods apply to most Mesa SFRs. While statewide rent control provisions are not generally applicable in Arizona, always confirm current law with qualified counsel.
Eviction timing has largely normalized since the pandemic, but local court backlogs can still affect schedules. Document everything, and use digital tools that timestamp communications and work orders.
Review your landlord insurance for liability, loss‑of‑rent coverage, and any endorsements related to pets or short‑term use. Verify coverage during vacancy and for tenant damage.
A simple Mesa SFR playbook for the year
- Update your rent comp set quarterly using Mesa ZIPs and Phoenix MSA trends, labeling single‑family versus mixed datasets.
- Aim for spring or early summer lease expirations. Use shorter renewals or extensions during the off‑season to re‑align timing.
- Pre‑schedule turns: line up cleaners, painters, flooring, landscaping, and HVAC service two to three weeks before move‑out.
- Price smart: Start at the competitive midpoint, watch applicant volume in the first seven days, then adjust.
- Adopt a leasing and tenant portal to compress time‑to‑lease, improve collections, and raise renewal odds. Measure your KPIs before and after to confirm the payoff.
- Partner with a local, full‑cycle team that can price, market, lease, and manage under one roof so nothing falls through the cracks.
If you want a practical, East Valley‑focused plan for your specific property, reach out to the local team at Snow Realty & Property Management. We combine professional marketing, digital tenant portals, and on‑the‑ground management to help you protect cash flow and reduce vacancy.
FAQs
What are current Mesa single‑family rent trends?
- Mesa follows the Phoenix metro pattern of post‑2022 normalization. Track asking and effective rents, days on market, and inventory by ZIP for the clearest picture.
When is the best time to list a Mesa SFR?
- Late spring through summer typically sees stronger applicant volume and faster lease‑ups. Align lease expirations to that window when you can.
How much should I budget for a turnover in Mesa?
- Plan for about $500 to $2,500 for a basic turn and $2,500 to $6,000 or more for a moderate scope, plus vacancy loss based on your expected days empty.
Are rent concessions smart during Mesa’s off‑season?
- Small, short‑term concessions can reduce time‑to‑lease in late fall and winter. Keep them targeted and time‑bound, and revisit pricing first.
Which landlord‑tenant laws matter most for Mesa rentals?
- Review the Arizona Residential Landlord and Tenant Act for deposits, notices, and remedies, and check City of Mesa ordinances as needed. Confirm specifics with counsel.